As noted in last week’s blog on freeing up in-house ERM resources, your organization has probably experienced a substantial increase in the volume and complexity of risks over the past five years, and yet you have insufficient resources to strengthen your ERM processes to manage these new threats.
These statistics from NC State’s report, The State of Risk Oversight, might help you make the case for hiring more staff, but it could take months to bring new risk managers and analysts up to speed.
So, what can you do to make the most of the resources you have? Focus on the right risks.
But how do you know which ones to focus on?
Heatmap Limitations
When it comes to scoring and reporting on risks, it seems that most organizations use some form of the heatmap, or risk matrix. Typically, it captures Impact and Likelihood scores, allowing risks to be compared to one another.
Here’s an example heatmap using a 1 to 5 scale:
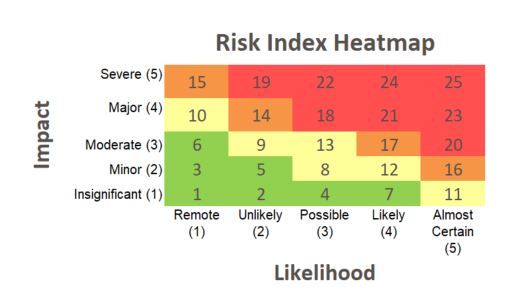
If you want management to avoid this red-laser focus and to put resources where they’re really needed, then you need to give them more than a heatmap to work with.
If we take the following raw data for Risks 1 and 2 and plot them on this heatmap, we see that the scores are 18 and 20, respectively:
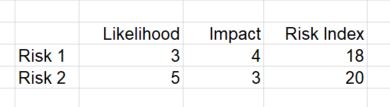
Since these risks are in the red zone of the heatmap, executives will want to assign resources to perform mitigating activities to bring down the scores. They’ll also expect your ERM staff to monitor these risks closely and report on them regularly.
This makes sense until you come across risks that are always orange and red, no matter how many resources you throw at them. And then there are risks that management expects to be high, and they’re alright with that. So, why are you still spending your limited resources on them?
If you want management to avoid this red-laser focus and to put resources where they’re really needed, then you need to give them more than a heatmap to work with.
Here are a few tools and data elements you can start implementing today to revamp risk assessment in your organization.
Risk Tolerance
As noted in a previous post, the Risk Appetite defines the amount of risk the organization is willing to take to achieve strategic objectives. Once you’ve worked with the board and senior executives to set the Risk Appetite, you should set boundaries around it called Risk Tolerances. It’s these Tolerances that make the Risk Appetite actionable because they tell the business units what level of risk is acceptable and what is not.
Using the same example risks noted above, let’s assume that management has set Risk Tolerances for the various Risk Categories of the organization (e.g. Operational, Financial, Compliance, and Reputation). When we score the risks, we can collect an Impact Score for each of the Risk Categories and compare that to the Tolerances, as shown here:
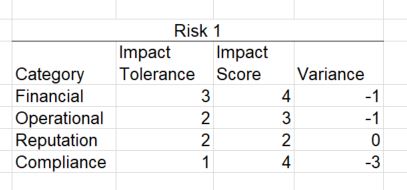
Instead of saying “this risk is higher than that one,” we can now say, “the Compliance aspect of this risk is outside of our Tolerance.” We can even show this variance using a Radar chart:

Now we’re getting somewhere!
Controllability
If you identify aspects of the risk outside of the Tolerance, you should work with the business unit to identify Future Mitigations that can further reduce the risk. You can help the business unit create an Action Plan and monitor their progress as the risk is reduced.
If Future Mitigations cannot reduce the risk further, you may determine the risk is outside of the control of the organization. Working with the business unit, determine if the risk can be transferred. If not, then you may need to suggest that executives accept the risk (as a last resort).
Positive Risk
We all know that risks can have an upside as well as a downside. So why not capture that in your risk assessment?
Take your regular Risk Impact Matrix and create a companion Positive Impact Matrix to capture the positive impacts of risks. Be sure to use the same scale so you can compare the two.
For example, if you determine a risk could have a negative impact of 4 for the Operational Category, but it could also result in a positive impact of 3 for the Financial Category, you should have a good conversation with management. Perhaps some mitigation can be put in place to lower the impact to the Operational area, while other activities could allow the organization to seize on the Financial benefits.
This is the kind of insight and value you should seek to provide to the organization…and if you’re not busy tracking the same two “red risks” all year, you might have time to do it!
In fact, you can save time now by using a simple Excel workbook to capture your risk information and create your own Radar charts. To download a sample spreadsheet you can begin using immediately, complete the short form at the bottom of this post.
Yes, it will take a little time and effort to establish these tools and data elements in your processes and reports, but you’ll make it up many times over if you use this information to get the most out of your resources!
Have you used these elements to prioritize your risks and assign resources? Do you use other data points?
We want to hear from you!
If you have any thoughts on prioritizing risks you would like to share, or any questions, enter them in the comments section below or join the conversation on LinkedIn.
And if you’re struggling with risk assessment and how to focus your resources to their most efficient use, continue browsing ERMInsightsbyCarol.com to learn more or complete this form to be added to the consulting & coaching waitlist.
About the author
Ashley Jones joined ERM Insights by Carol in June 2017. She graduated from Florida State University in 2003 with a B.A. in Risk Management and Insurance and obtained the Project Management Professional (PMP) designation in May 2012. Ashley has fourteen years of experience in the fields of insurance and risk management, most notably as a Senior Risk Analyst within the ERM department of a $7+ billion property and casualty insurance company. When she’s not working on project or risk management, Ashley is busy writing, blogging, teaching, and speaking on a wide variety of topics.