
No ERM process that is effective at helping a company understand threats and opportunities to achieving objectives is going to just create a list of risks. While that may be sufficient for a regulator, it means absolutely nothing for helping executives run the organization better.
After identification, companies then take the vital step of assessing risks to understand which ones they should prioritize. After all, how will you know the company is focusing on the right risks and opportunities?
Broadly speaking, there are two methods for assessing risks – qualitative and quantitative.
Qualitative assessment uses descriptive elements to rank a particular risk, usually in the form of a 1-5 scale or high, medium, or low, while quantitative uses hard numbers such as a dollar impact or some other metric.
Qualitative methods are by far the most commonly used, but as many risk management thought leaders contend, it is fraught with bias and only provides a static view of risk and is therefore not useful for decision-making. Quantitative methods are considered to be more objective and provide a better understanding of how risks impact the organization, but they do require some level of data analysis and modeling capabilities that many organizations simply do not have.
However, this is not the primary reason why many organizations shun quantitative risk assessment methods.
It’s a common perception that only select industries, like numbers-based financial services and manufacturing companies, are equipped to take advantage of quantitative risk assessment.
Banks have a treasure trove of metrics to pull data from such as loan default rate, interest income, reserve ratios, and more. Second to that, manufacturing has a variety of metrics they use for understanding performance and efficiency, including throughput, capacity utilization, reportable health and safely incidents, and much more.
While financial firms have the most experience with quantitative assessment, the truth is every organization, regardless of industry or sector, is going to have data they can use…
Unless you are strictly paper-based (I sincerely hope you are not in this day and age), every organization in every sector and industry will have numbers. This can include numbers around financial performance (fundraising in the case of a non-profit), employee retention and turnover, and customer service metrics (such as calls per week or what is known as a Net Promoter Score).
If used and communicated properly, these numbers can tell a more robust, actionable story about risks than any qualitative 1-5 or low-medium-high ranking.
Let me elaborate…
In a typical, qualitative risk assessment, executives and business unit leaders are asked to rank the impact and likelihood of a risk. With these static scores in hand, a heat map can be developed, which according to COSO, is simply “…a graphical representation of likelihood and impact of one or more risks.”
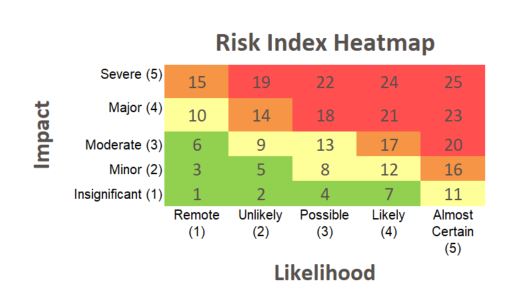
The problem with heat maps and other similar graphical representations is that they assume risks exist in one spot on a graph. This can be misleading and even dangerous to an extent since impacts can change based on the likelihood of an event.
The ultimate goal of quantifying risks is to understand likelihood of success…
In his latest book Decide to Succeed: Why and How to Apply Effective Decision Risk Management, Hans Læssøe explains:
The purpose of risk managing a decision is to enhance the outcome, and hence your focus is not to be focused on the uncertainty, risk or opportunity itself – but on the performance parameter of your decision/project.
As I explore in this post and repeat often, risk professionals must communicate in a language decision-makers can appreciate and understand. Therefore, the measurement of risks must be done in a way that matters to executives. When used correctly and in the right context, data can support this process.
Here’s how it should roughly work…
Your organization has a goal (e.g., increase revenue) and different objectives for reaching this goal (e.g., develop new products, repurpose existing products to new market).
You as the risk professional, in coordination with relevant stakeholders, can develop scenarios around these objectives. As I explain in a previous post on essential questions for effective scenario planning, the high-level purpose is to ensure goals and objectives are the right ones.
Risks can then be identified around these scenarios. Any relevant data can be used to develop models or Monte Carlo simulations that can then determine the likelihood of a particular objective being met.
Here’s one example from Hans’ book that provides some concrete numbers on the likelihood of meeting specific targets of a project:
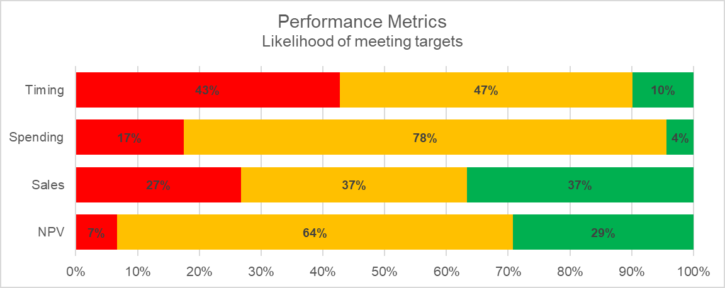
From this chart, we can see that there is a 57% chance a project will be finished within the desired time frame and an 82% chance the project will come within acceptable budget targets. Executives can take this information to determine if the project should move forward as-is, be modified, or abandoned.
But how can I get data?
In order for models and simulations to work though, you must have data, which gets us back to the heart of today’s topic.
Like I said earlier, every organization is going to have data. However, even without direct numbers like revenue or customer satisfaction, it is possible to assign numerical values to a variety of intangibles, including reputation. Other examples of intangibles besides reputation include management effectiveness, research productivity, political uncertainty – the list is endless.
The book (…and accompanying workbook) How to Measure Anything: Finding the Value of “Intangibles” in Business by Douglas Hubbard provides tools and methods organizations can use to put numbers to a variety of metrics.
As his book explains though, the purpose of measuring and analyzing for decision-making isn’t to produce a perfect result, but to reduce uncertainty so executives can make the best decision possible.
While it would be wise to not rush into modeling, quantitative methods are increasingly becoming more essential, especially as the world continues moving toward more and more automation and society has less tolerance for problems or missteps.
How does your organization overcome the data challenge to assess risks for executive decision-making?
To share your thoughts on this interesting topic, feel free to leave a comment below or join the conversation on LinkedIn.
And if your organization is struggling to understand how it can use number-based, quantitative assessment methods to make better informed decisions, please reach out to me to schedule a call.